Developing Metrics
Section Overview
In this section, we provide three key steps to develop metrics that track your base-building and leadership development efforts. They are:
- Identify who’s in your base and the relationships that you’re building;
- Define the relationships and roles; and
- Build metrics based on those defined relationships and roles.
After laying out the three steps, we discuss some additional best practices for developing metrics.
The metrics we’re encouraging you to consider here are grounded in an existing theory of power and organizing — that base-building organizations build power by cultivating a large, committed base and developing the autonomy and leadership skills of that base. (If you haven’t already, read the “Overview” section for more on this theory of power). To begin to assess whether you’re building power in this way, you need to know who your base is (i.e., who you’re building relationships with), and how they’re stepping into leadership. By grounding your metrics in the relationships you’re building and the roles members of your base hold, you can begin to better understand your base, their commitment, and their leadership abilities - now and over time.
As you develop your metrics, stay aligned with your team. You might take the lead and gather feedback afterward, or you can work through the steps collaboratively with key stakeholders from the jump. Either approach works. What matters most is that your organization shares a clear understanding of who’s in your base, how you’re cultivating relationships and leadership within it, and which metrics will help assess that work in the short and long-term.
Step 1: Identify Who’s in Your Base and the Relationships That You’re Building
You should be able to name who’s in your base, guided by your organizational strategy. The purpose of naming your base explicitly is to make sure your organization is collecting or will collect data about them and how your organization is building relationships with them.
If you are struggling to name your base, the Midwest Academy provides useful prompts in their Strategy Chart. They ask:
- Who cares about the issue?
- Whose problem is it most directly?
- What do they gain if they win?
- Who else will be an ally on this issue?
- What power do they have over the Decision Maker?
- How are they organized; where can you find them?
Be specific about the distinct groups in your base. Don’t just describe broad demographics like “low-income communities” or “people of color.” Instead, be clear about who you’re engaging, at what level, and why it’s in their interest. Are you organizing individual people, households, congregations, or tenant associations? In what geography? And why is it in the interest of those people or groups to join your base? By naming the actual people and communities you are organizing with, you will be able to specify the distinct data that may need to be collected for each group.
Whether you are organizing individuals or groups, most of your metrics will likely be at the individual level, because that is where things like commitment, leadership, and actions are most easily measured initially (they can be aggregated up later). However, if your organization identifies groups themselves as part of your base (in addition to the individuals that make them up), you may want group-level metrics, too. We’ll go over this in more detail in Step 3.
Step 2: Define the Relationships and Roles
Once you’ve named your base, develop definitions for the roles that the different people or groups can play in your organization. Developing shared definitions of roles — like “member,”, “volunteer,” and “leader” — will help you determine trackable metrics to collect. These role definitions need to be developed with other stakeholders. This will help your organization identify whether and where understandings are incomplete, siloed, or inconsistent.
We recommend using a ladder of engagement (also known as “circles of engagement”). It’s a model for organizing roles that range from lower-commitment actions to deeper levels of involvement, leadership, and responsibility. In the ladder, each rung represents a specific role or group of actions of increasing difficulty. For instance, People’s Action’s leadership ladder has five rungs: prospect, new recruit, activist or supporter, leader, and primary or core leader. A person who recently joined your organization may show up at the bottom of the ladder. As that person becomes more invested in the work, takes on greater responsibilities, and becomes more autonomous, they move up to a higher rung of the ladder. For the general structure of a ladder of engagement, check out this post published by The Commons.
As you assemble your ladder of engagement, consider both the organizing work that needs to be accomplished and the type of data that you’ll need to support it (see “Data Infrastructure: Decide on Data to Collect” for more on collecting data to support your metrics). Try to ground the role definitions in observable and trackable actions – this will make data collection easier. Here are some questions to help you define roles for your ladder of engagement:
- For each rung, what potentially trackable action(s) does someone need to take?
- What actions can an individual take (or not take) to move up (or down) the ladder of engagement?
- What actions do you expect all individuals to take regardless of their position on the ladder? (As an example, some groups strive to have all of their members pay dues no matter if they are leaders or new activists.)
We recommend checking out People’s Action’s Leadership Ladder framework. While designing their framework, People’s Action made sure that lower rungs are defined by easily observable, automatable actions tracked through digital tools. Higher rungs are defined by more subjective inputs (such as “builds their own base of relationships” and “begins to identify the organization as their primary political home”). This structure gives PA’s affiliates the flexibility to fill in the details of each role based on their specific organizing needs, while also being scalable.
Step 3: Build Metrics Based on Those Defined Relationships and Roles
Once you define your relationships and key roles, it’s time to develop metrics! Your metrics will track the roles and relationships you’ve defined.
Create metrics based on your roles
In Steps 1 and 2, you named the types of relationships your organization holds and the types of roles that those individuals and groups play. You’re now ready to take those definitions and turn them into metrics. To guide you through this step, we’ll use People’s Action’s leadership ladder as an ongoing example. We’ll borrow materials directly from their Ladder of Engagement Workbook, a supplementary document with a series of exercises designed for their affiliate members.
Begin by listing the observed actions needed for each role. As we mention in Step 2, focus on actions that are trackable. You’ll also want to make sure that each action is time-bound, so that you can track whether someone becomes inactive. As an example, let’s say your leadership ladder includes the following roles: “Supporter” and “Leader.” To qualify as a supporter, the individual needs to contribute annual membership dues and attend monthly meetings. To become a leader, the individual also needs to canvass their neighborhood and hold one-on-one meetings with new activists on a monthly basis. Your list might look something like this.
| Role | Observed Actions |
|---|---|
| Supporter |
|
| Leader |
|
If your base includes groups as well as individuals, you may also want to consider the “roles” you envision for groups (e.g., co-hosting events, working in coalition, etc.), or even a “ladder of engagement” for groups. Alternatively, you may find that it makes more sense to think of specific members of the group as individual people in your base.
Once you have your list of roles and observed actions, you can now aggregate them into metrics. At a very basic level, each role can have a metric tracking its current size and new growth. Using the same example, we might have:
- # of supporters
- # of leaders
- # of new supporters in the past quarter
- # of new leaders in the past quarter
If you want to get more granular, you can break these role metrics down into smaller components — by geography, demographics, or even by specific campaigns — based on your organizational strategy. For example, if your goal is to organize working class people in the South, you might add the following metrics:
- % of leaders who live in the South
- % of leaders who identify as working class
Consider how you want to track your metrics over time. These metrics give you a static snapshot of your base as it is now. But you’ll likely want to examine your base and leadership development over time to see how your organization is growing and changing. For instance, by comparing what you did this year to last year to the year before, you can assess whether you’re making progress toward your goals. Tracking metrics over time will help you better tell the story of your organizing work.
You can track change over time in a couple of ways. One way is to take static metrics like those used in the example above, and display them over time. For example, you can look at how your total number of supporters has changed over time, how your number of leaders has changed over time, or how the percentage of leaders who identify as working class has changed over time. A graph is a good way to display this information. For example, you could make a graph of “#of new supporters in the past quarter” to track how the number of supporters you brought in this quarter compares to the quarter before and the quarter before that. A second way to incorporate time is to build time into the metrics themselves. Using the same example above, you might create metrics such as:
- % change in total supporters year-over-year
- % change in total leaders year-over-year
- Etc.
This can tell you, for example, that your total number of leaders grew by 30% over the past year. Be thoughtful about the period of time you choose for each metric. Ask yourself: What is the relevant time period? Monthly? Quarterly? Yearly? Something else? Choose time periods that are ambitious but also relevant to your work.
The number of metrics can balloon here. To help narrow it down, think through what will most help you evaluate growth or progress over time. What indicates success?
Balance objective and subjective data. As we’ll discuss in the next section, “Sketching the Blueprint of Your Data Infrastructure,” data collection shapes the scalability of your metrics. Objective data — like event attendance, training completion, canvassing shifts — can help you track early engagement and automate parts of your system. These indicators are especially useful for supporting large numbers of people at the base of the ladder.
As people move deeper into leadership, you may want to incorporate more subjective, but still observable, assessments. For instance, People’s Action’s leadership ladder framework gives organizers more flexibility to assess whether their leaders are assisting with strategic planning and building their own bases. These nuanced indicators are harder to automate, but they matter deeply. Balancing the two helps ensure your metrics system can scale, while still honoring the depth of leadership you’re building.
Identify event-level metrics, if they help track how you’re deepening relationships
Once you have the role metrics, go back to your list of observed actions for each role. Are there key actions that your organization needs to take in order to move people up your ladder of engagement or generally strengthen their connection with your organization? Like many base-building organizations, Fair Count recognized that one-on-one meetings and their Democracy Academies were crucial to their development of leaders. Their organizers used one-on-one meetings with new activists to deepen their relationships and plug them into Fair Count’s work. Their Democracy Academies provide in-depth organizing training to produce new leaders. Given their centrality to Fair Count’s base-building and leadership development efforts, they decided to create event-level metrics to track those actions.
Here is Fair Count’s first set of metrics. In this early version of their dashboard, you can see how Fair Count chose metrics that highlighted the relationships they sought to build. Fair Count’s organizing program involved canvassing rural Georgian residents, building trust through one-on-one conversations, partnering with local faith institutions, and offering in-depth leadership training through Democracy Academies. Their dashboard was designed to reflect these efforts.
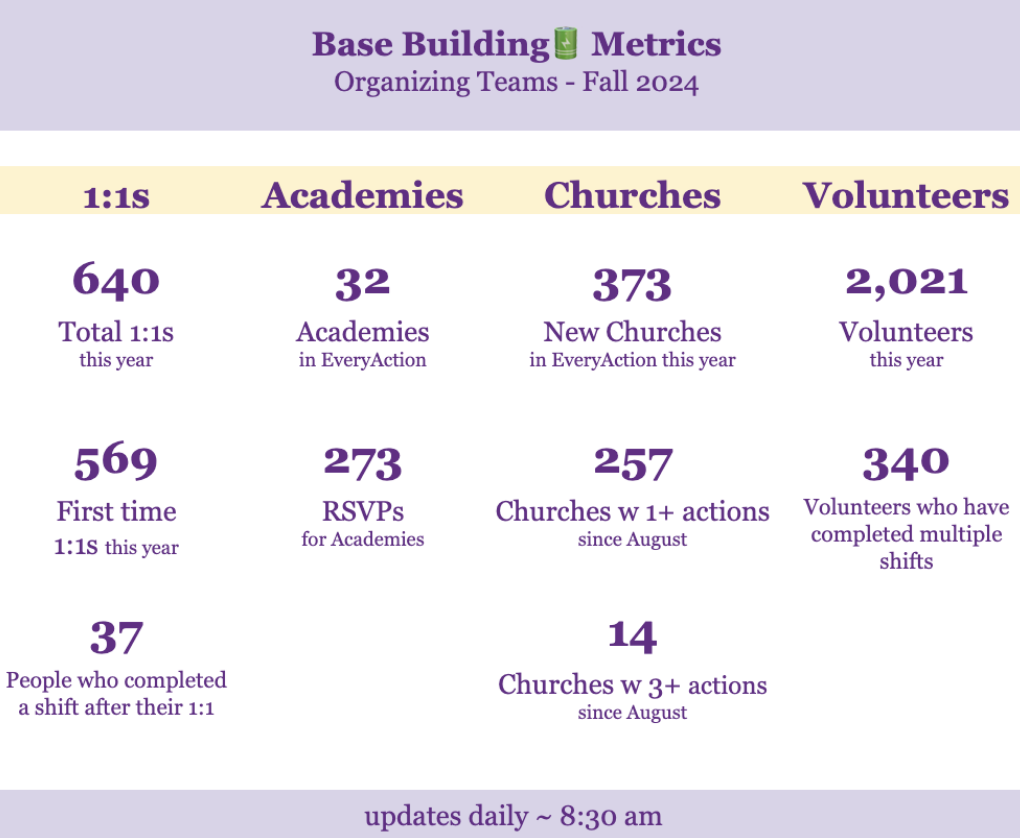
In an updated version, Fair Count plans to add additional metrics including but not limited to: the number of contacts (not just churches) who have taken action; number of contacts who have taken low and high level actions; and number of people who have completed Fair Count’s different leadership academies. They will also track these metrics over time in order to assess their growth.
If you’re having trouble getting started with the above steps, this exercise could help you and your team generate some ideas.
For this exercise, imagine an ideal dashboard. (See the prompt Fair Count used to help their team collectively create their dream dashboard in the image below.). A dashboard is a visual tool that can help you visualize and consolidate key information. It can include graphs and tables, maps, and even quotes and themes. The right dashboard can help you track progress, spot trends, and prompt reflections about your current efforts.
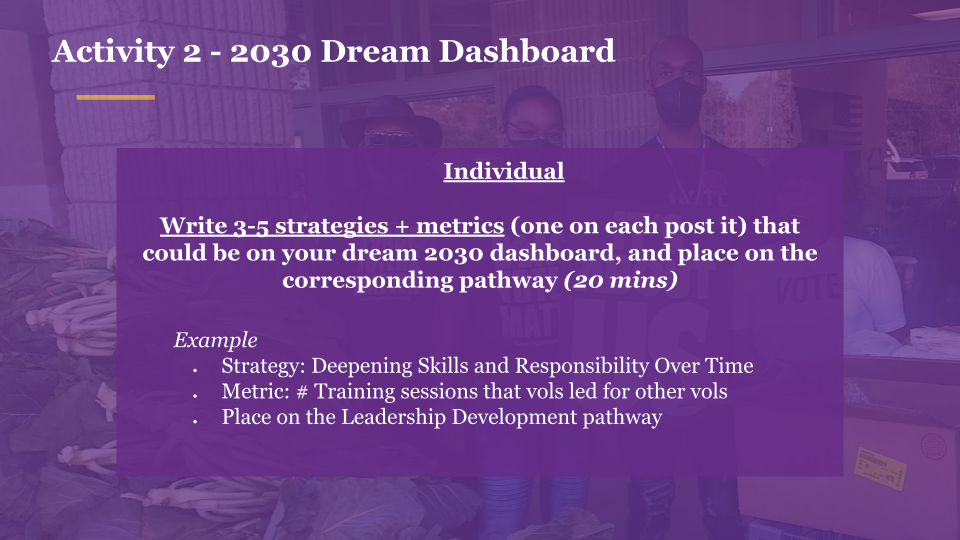
What metrics on that dashboard would best describe the breadth and depth of your organization’s relationships, both a snapshot of right now and over time? What metrics would help you to identify membership or leadership gaps, and allow your organization to do its best work? What’s sorely missing from your current metrics and preventing you from telling the story of your work?
After you brainstorm, trim your list of metrics down to the essentials. See the Narrow down your metrics section below for new ideas on how to do this.
Take a look at the definitions and metrics the learning cohort developed.
Metrics will differ by organization and their organizing contexts. However, if you find it useful to see what other organizations are tracking, here’s a list of common relationships and metrics that our cohort members assembled.
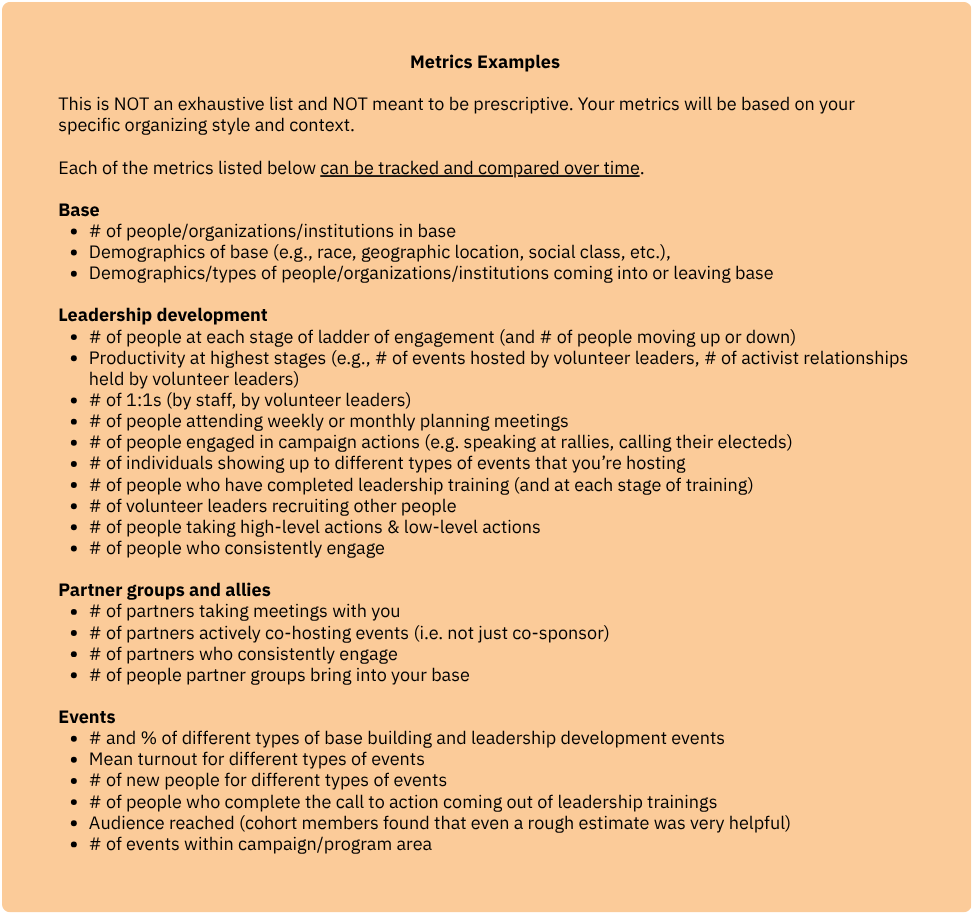
To keep them accessible to a broad audience, these metrics are vague. You’ll need to make them specific and measurable, based on the roles and relationships your organization holds. Be thoughtful about how you represent the actual numbers vs goals, the time period that’s being represented, and how it compares to similar work in the past (e.g. “Volunteers held 157 one-on-one meetings this week, which is higher than our weekly goal of 140 and the 64 one-on-ones conducted this week a year ago”). These help provide context for how well the work is going and how it’s progressing over time.
For more metrics ideas, check out the elements and metrics that we’ve listed under Base-building and Leadership Development in the original Pathways to Power, pages 10-12 and 14-15.
Other (Important) Things to Consider
Narrow down your metrics
Once you’ve thought through metrics that capture your organization’s relationships and roles, you’ll likely want to narrow down your metrics list. It can be helpful to focus on the metrics that are both most informative and feasible to measure. Good metrics should be useful for informing strategy, have benefits that are easily explained to the staff collecting the data, and be measurable. Use the chart below to compare how informative and feasible your various metrics are by placing them on a spectrum from “high strategic insight” to “low strategic insight” and from “difficult to measure” to “easy to measure.”
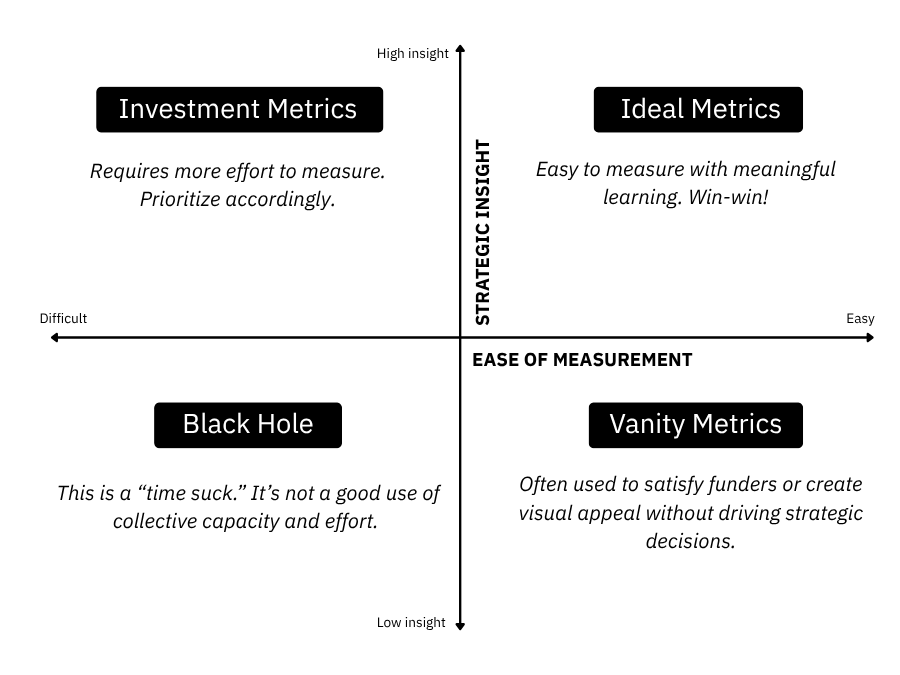
Try to select most of your final metrics from the “Ideal Metrics” and “Investment Metrics” quadrants. People’s Action, for example, plans to select roughly 80% of their final metrics from the “Ideal Metrics” quadrant, 15% from “Investment Metrics,” and 5% from “Vanity Metrics.”
Deeper metrics may have smaller numbers - and that’s okay
Deeper metrics will often have smaller numbers that reflect the true, slow pace of base-building and leadership development work. It takes time to build a deep, committed base and for volunteers to step into meaningful leadership. Smaller numbers may feel new to people (including funders) who are used to looking at the impressive numbers of doors knocked or texts sent. But these numbers shouldn’t be compared. The metrics we’re hoping you develop here capture a different aspect of your organizing work. Rather than measuring surface-level contacts made, they get at the relationships your organization holds with your base and the leadership, autonomy, and commitment your organizers develop within members. Fair Count found that although their new numbers were lower than what they often share, organizers were excited to see them. Fair Count’s new metrics told the story of their organizing work and generated pride in their organizing accomplishments.
Also keep in mind that your numbers may look very different depending on seasons of organizing; a big election year will likely look different, both in the numbers of actions people take and the events they go to, from a non-election year. A state-based organization doing work at the state legislature will look really different during a legislative session or a campaign than at another time.
Make metrics motivating
There was broad consensus among cohort members that good metrics capture something valuable about power building and help organizers reflect and strengthen their work. Bad metrics feel extractive or punitive. Our work with the cohort uncovered some effective ways to create metrics that are motivating and useful to leaders and organizers alike.
Most importantly, invest in participatory designs and feedback loops. Where organizations saw success, it was often because they invested time in participatory design, honest reflection, and feedback loops. People were more willing to adopt new systems when they understood the purpose, saw their input reflected, and saw that metrics could help—not just evaluate—their work (see the “Overview” section, “Lay out the benefits of this work” in the “Buy In” section, “Who’s collecting the data” in the “Data Infrastructure” section, and below for more on how metrics can help organizers).
Design metrics that organizers, program staff, and executive staff can use to make decisions. The right metrics can help organizers categorize their relationships, determine who to follow-up with (e.g. prospects, potential leaders, lapsed members), and gauge the strength of their base. They allow organizers to take the lead and fine-tune their own strategies. For program and executive staff, metrics can show the lay of the land of your organization’s power building efforts, and help them decide where to direct resources and when to pivot.
Use metrics that help organizers tell the story of their work. Ask organizers what metrics will help tell their story. How do they see the story of their work? For example, Fair Count’s metrics, shared in the dashboard earlier, told the story of the different components of their base and how they were deepening relationships with and growing the leadership of each group in different ways.
Use metrics to celebrate wins. Organizers’ hard work is often invisible, becoming visible only when organizers win a campaign. But organizers’ work fosters relationships and builds leadership skills that persist beyond the end of a single campaign (win or lose) and can be built upon to grow long-term power. The metrics we describe here can make visible this often overlooked work. We recommend using your new metrics to highlight and celebrate your organizers’ achievements.
Keep in mind that this approach is not the only way to measure the size, makeup, commitment, and autonomy of your base.
The approach described in this section builds metrics from relationships and roles. We focus on this approach because we believe it’s more scalable. But this is not the only way to look at base building and leadership development work. In addition to your role metrics, for example, some organizations may consider tracking who brings who into your base. For example, Joe brought in Jack, and Jack brought in Jill (you could collect this data by asking “Who brought you to this event?” on attendance sheets). This example is another way to get at leadership: the people who bring in the most other people are natural leaders, and you could tap them for additional leadership responsibilities. You could even do a network analysis to fully visualize how people bring others into your organization.
Another approach is to capture qualitative data about how individuals join your organization and develop into leaders. These might come from an organizer’s 1:1 notes or testimonials. While it’s more difficult to measure these at scale, they highlight key turning points in someone’s leadership journey. These stories can reveal patterns of growth and motivation that complement your quantitative metrics.
A third approach to understanding the makeup and commitment of your base is to use surveys that get at, for example, the self-reported commitment of members. See DPI’s Power Metrics: Measuring What Matters to Build A Multiracial Democracy for other ways to measure your base-building and leadership development work.
In sum, there are many ways to go about developing power building metrics and many directions you could take. But what we lay out here gives you a solid foundation that you can choose to build upon later. The metrics we cover here provide the foundational information you need to understand your base. They allow you to systematically document who your base is, their leadership skills, and how they develop over time.